![]()
![]()
![]()
![]()
![]()
![]()
|
|
|
Previously, introduction to the Multivariate Anova, Multivariate Visual Error Oval, and Multivariate Anova part 2. This page explores the multivariate analysis of variance by considering an approach by way of regression. The approach is unusual, in that the question answered by a multivariate anova (is one group different from another group considering the measures together) would not normally be addressed by a regression analysis. Translation — an investigator would not usually look to regression for an answer on this question. Fortunately, we are not a usual investigator and a couple of delightful findings await us. We rehearse our understanding of constructing a regression analysis of what would normally be a simple univariate anova (one measure and two or more groups). Usually, we wish to predict the measure from Group membership, and so we set up the regression with Group as the independent variable and the measure of interest as the dependent variable. The usual regression question is, given a correlation between Group membership and the measure, can we significantly predict the change in the measure with the dummy variable for Group membership. If we have a factorial anova, we set up further dummy variables for the main effects and interactions and regress them in varying combinations against the measure. Here, we do the opposite. We test the prediction of Group membership from its correlation with the measure of interest. The independent variable is the measure, and the dependent variable is Group membership which is coded as a dummy variable. We use "0" and "1" for Control and Treatment; other contexts may find "1" and "–1" more convenient. The reason we do this is because we wish to extend the regression analysis to two measures in due course, but a regression analysis can only have one dependent measure, although it can have an arbitrary number of independent variables. So when we move to a regression with two IVs and one DV, we find that, in order to do this with our multivariate data, the DV must be Group membership and the two IVs are the variates of Confidence and Test score.
Regression analogue of the univariate anovaWe take the background and data of Table 1 from the Multivariate Anova page. The correlations between Group membership, Confidence, and Test score are shown in Table 1. Table 1. Correlation matrix
The correlations between Group membership and the two measures are modest and, with df = 16, their p values are 0.31 and 0.30. The correlation between the measures is very significant, p <.001. We undertake two regression analyses, one regressing Confidence against Group membership, and the other regressing Test score against Group membership. The two analyses are provided in Tables 2, 3, and 4. The first of the tables provides the regression summary, R. The second provides the anova summary table of the regression, and the third the regression coefficients. Table 2. Regression summary
The value of R² for each regression is very modest. The usual interpretation of R² is the percentage of variance explained in the dependent variable, Group membership, by the independent variable, one or other of the measures. It seems that Confidence explains around 6% of the variance in Group membership, and Test score 7% (see Note §2 for a discussion of the meaning of this interpretation). The square root of R² is, er, R, which in the case of a single predictor, is the same as r between the independent and dependent variables. As noted earlier, R = r = 0.25 and 0.26 for Confidence and Test score respectively. Table 3. Regression anova summaries
As might be expected, the anova summary for the regression of Confidence on Group membership is not significant, and similarly for Test score. Note that the p values of the F statistic are identical with the p values of the correlation coefficient (within rounding error) that we found earlier between Group membership and the relevant measure. This will always be the case for single predictor regression. Table 4. Regression coefficients
We recall that B is the size of the effect (§1) of the independent variable (here Confidence in one regression, Test score in the other) on the dependent variable (Group membership). Each unit of Confidence is associated with 0.06 units of Group membership, and each unit of Test score is associated with 0.01 units of Group membership (§2). (§1) Very important to be careful with the order of the words. B is not an effect size, it is the size of an effect. The "size of an effect" is the difference that a condition or variable makes on the value of some other variable. Usually, the condition is something like "drinks an elixir", and the size of its effect might be "+1" on Confidence and "+5" on Test score, and indeed this is exactly the size of the effect of the elixir as seen by the difference between the Control and Treatment means on these measures — from 10 to 11 for Confidence, from 50 to 55 on Test score. On the other hand, the "effect size" is the size of the effect relative to the standard deviation of the variable concerned. The effect size of elixir on Confidence is 0.5, and on Test score it is also 0.5, because s = 2 for Confidence, and s = 10 for Test score. (§2) This is a rather awkward to interpret expression of the result we see in Table 4, and is often the reason that most investigators ignore B anyway and interpret Beta for preference. But let's pursue this here. We may begin with the earlier observation that we made on Table 2 that Confidence explains around 6% of the variance in Group membership. What might be meant by such a finding? The very short answer is, not much, because Group membership is a dummy variable. It consists of an equal number of 0's and 1's, and while it technically does have a mean, standard deviation, and variance (0.5, 0.51, and 0.26 respectively) it has very little intrinsic meaning. We see that B = 0.06, so that each unit of Confidence is associated with 0.06 units of Group membership. Group membership is either 0 or 1, and 0.06 of Group membership is somewhat awkward to interpret. We may say that a unit of Confidence nudges us towards the Treatment group, because B is positive, and that 10 units of Confidence nudges us 0.6 along the 0 to 1 line towards the Treatment group. Well, OK, are we now closer to Treatment than to Control? To answer that, we need to know that the constant in the prediction equation is –0.170 (not shown in the table but always shown in the report from the statistical software) and that B = 0.064 to 3 decimal places, so when nudged along by, oh, lets say 10.5 units of Confidence we arrive at 0.500 Group membership. Aha. The mid-point of Group membership, 0.5, corresponds to a Confidence score of 10.5. Not too surprising given that mean Confidence for the Control group is 10 and for the Treatment group is 11. Back to Table 4, we see that Beta for Confidence is 0.25. We recall that Beta is the value of the correlation coefficient of the variable with the dependent variable, much easier to interpret, and indeed we have seen this value earlier in Table 1 where the correlation of Confidence with Group membership was r = 0.25. Just before we leave our univariate regressions, we recall the univariate anovas provided for the data of Table 1 from the Multivariate Anova page, and reproduce them here. Table 5. Univariate tests of Table 1 data from Multivariate Anova
The results are identical, in the sense that the F ratios and p values associated with the measures of Confidence and Test score are identical. SS and MS are quite different, but that is simply because the Table 5 data refers to the effect of the elixir on the measures of Confidence and Test score, while the Table 3 data refers to the effect of the measures (Confidence and Test score) on Group membership.
Regression analogue of the multivariate anovaA multivariate anova addresses the question, "Does a treatment (ie Group membership) have an effect on two or more measures *taken together*?". To answer this question using regression, we regress Confidence and Test score as IVs against Group membership as the DV. Not something you'll see in many textbooks or web pages. For the data of Table 1 from the Multivariate Anova page, Table 6 provides the regression summary, Table 7 the regression anova summary, and Table 9 the regression coefficients. And Table 8 reproduces the multivariate anova test of the Table 1 data from the Multivariate Anova page. Table 6. Regression summary
We see that R and R² are very modest. When taken together in the regression (§3), Confidence and Test score do not predict Group membership very well. (§3) We pause here to remember that regression with two or more IVs takes the IVs *considered together* and examines their relationships with the DV. This means that we may see a different relationship between an IV and the DV when the IV is taken together with other IVs compared with when it is considered separately. Specifically, the statistics for an IV in a regression (prediction) equation relate to the contribution of that IV towards the prediction which is independent from (unique, extra, or additional) the other IVs. It is not uncommon to find that an IV may correlate significantly with the DV, but when entered into a regression with other equally-well correlated IVs, we find that its contribution is negligible and non-significant. On the other hand, it is rather uncommon to find an IV that correlates only modestly with the DV, but when entered into a regression with other well-correlated IVs, we find its contribution becomes significant. Such an unexpected finding is important and tells us something about the collection of IVs taken together that cannot be known when their relationships with the DV are considered separately. Table 7. Regression anova summary
As expected from the small R, we see that Confidence and Test score do not predict Group membership significantly, p = 0.55. We have seen this result before, of course, in the original multivariate test shown in Table 8, where the F ratio, df, and p are identical to Table 7. I never cease to be amazed at the deep connections between regression and the analysis of variance. Our very unusual linear regression has yielded the same result as the far more usual deployment of a multivariate anova. Table 8. Multivariate test of Table 1 data from Multivariate Anova
Table 9. Regression coefficients
No need to spend too much time here, because the big reveal is in the next section, except to note that the regression coefficients here for Confidence and Test score are not significant. Not at all surprising, they were similarly not significant in the multivariate analysis earlier, but we might just pause for a moment and wonder whey are so very insignificant — p = 0.71 and 0.66 — when according to the univariate anovas of Table 3 and the single variable regression coefficients reported in Table 4 their corresponding p values were 0.31 and 0.30. Hopefully we'll see. The next section deals with the eye-opening multivariate anova of Table 11 from Multivariate Anova — the one where the centroid trend was opposite to the trends shown within the groups such that the multivariate test was significant but the univariate tests not at all. Have we mentioned that results can be very different when the variates are considered together? Yeah, a couple of times ....
Regression analogue of the multivariate anova, inconsistent centroid trendFor the data of Table 8 from the Multivariate Anova page, Table 10 provides the regression summary, Table 11 the regression anova summary, and Table 13 the regression coefficients. Table 12 reproduces the multivariate anova test of the Table 8 data from the Multivariate Anova page. Table 10. Regression summary
We see that R and R² are modest. When taken together in the regression, Confidence and Test score predict Group membership to some degree. (The regression anova summary tells us about significance, Table 11 below.) Using R² we can say that Confidence and Test score account for 32% of the variance in Group membership, but as stated such a finding does not make much sense. Fortunately, regression (and correlation) are measures of association; to bring causation into the picture, we rely upon the experimental arrangement, which allows us to say that it is Group membership which accounts for 32% of the variance in Confidence and Test score taken together. Conceptually, that is a firm statement; technically, well, a little fuzzy because Confidence and Test score are measured in quite different ways and represent quite different constructs. Table 11. Regression anova summary
We see that Confidence and Test score predict Group membership significantly, p = 0.05. And we have seen this result before, of course, in the original multivariate test from Multivariate Anova and shown in Table 12 here, where the F ratio, df, and p are identical to Table 11 here. Table 12. Multivariate test of Table 11 data from Multivariate Anova
We recall that the univariate anova tests of this data is the same as that shown in Tables 3 and 5 above as well as in Table 12 from the Multivariate Anova of this data, and that the univariate anova reported non-significant results for Confidence and Test score taken separately. Table 13. Regression coefficients
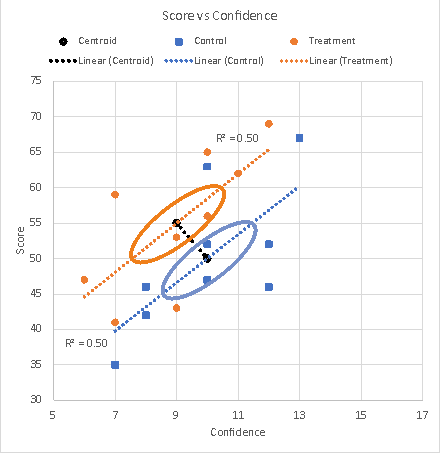
This is our big reveal — the Confidence and Test score coefficients are significant, p = .031 and 0.030 respectively. (There is no error in our copy of the table in case you thought that we added a 0 by mistake, since the p values in Table 5 are .31 and .30.) The first question is why is the significance for Confidence and Test score in Table 13 so different from what we might have expected given their non-significance earlier? The answer is that these two measures are considered together in the regression reported in Table 13, and not separately. We remarked on something similar regarding the regression coefficients of Table 9, which were considerably more non-significant than we might have expected. The answer is the same, that the Table 9 results were for the measures considered together and not separately. We reproduce the multivariate scattergram for this data from the Multivariate Anova page below as Figure 1, but with the addition of visual error ovals to aid interpretation.
Figure 1. Scattergram of the data of Table 8 from the Multivariate Anova page with added visual error ovals I need to quote from the Multivariate Anova discussion of this data, its findings, and the scattergram: "The multivariate analysis can test and then flag a result that cannot be tested or flagged by univariate tests [...] the elixir seemed to reduce Confidence even while seeming to boost Test score, but because the univariate tests were clearly not significant, we certainly could not publish such a non-finding." We are about to make the results publishable. When taken together with Test score (sorry to repeat this, but it is absolutely essential to the accurate statement of the results and their accurate interpretation), we see that Confidence is significantly negatively correlated with Group membership, Beta = –0.63, p = 0.03, and that is what we see in the scattergram — mean Confidence decreases after drinking the elixir, and significantly so. When taken together with Confidence, we see that Test score is significantly correlated with Group membership, Beta = 0.63, p = 0.03, and that is also what we see in the scattergram — mean Test score increases after drinking the elixir, and significantly so. High fives, please. (And hope the reviewer of your paper agrees with your, ah, unusual deployment of a regression analysis to explore a significant multivariate anova.)
Regression analogue of the multivariate anova, partially significant univariateWe now look at the first set of data from the Multivariate Anova part 2 page for a second example of the deployment of a regression analysis to explore a significant multivariate anova. In that set of data the multivariate anova was significant and one of the measures was significant by the univariate anova, but not the other. For the data of Table 1 from the Multivariate Anova part 2 page, Table 14 provides the regression summary, Table 15 the regression anova summary, and Table 18 the regression coefficients. Table 16 reproduces the multivariate anova test and Table 17 the univariate anova tests. Table 14. Regression summary
We see that R and R² are substantial. When taken together in the regression, Confidence and Test score predict Group membership. Permissibly inverting the interpretation, we can say that Group membership accounts for 44% of the variance in Confidence and Test score taken together. Table 15. Regression anova summary
We see that Confidence and Test score predict Group membership significantly, p = 0.01. And we have seen this result before, of course, in the original multivariate test from Multivariate Anova part 2 and shown in Table 16 here, where the F ratio, df, and p are identical to Table 15 here. Table 16. Multivariate test from Multivariate Anova part 2
Table 17. Univariate tests from Multivariate Anova part 2
We see that only Confidence shows a significant univariate effect, p = .01, while Test score is not significant, p = 0.30. Table 18. Regression coefficients
The interpretation of the coefficients is relatively straightforward. When taken together with Test score we see that Confidence is significantly highly correlated with Group membership, Beta = 0.85, p = 0.007. Mean Confidence increases after drinking the elixir, and very significantly so. The point here is that the simple correlation of Group membership with Confidence is 0.62, but when taken together with Test score it is 0.85. We see that Test score is not significantly correlated with Group membership when taken together with Confidence, Beta = –0.33, p = 0.24, but this does not change its interpretation from the univariate test where it is similarly insignificant.
Next: Multivariate Anova part 4.
| ||||||||||||||||||||||||||||||||||||||||||||||||||||||||||||||||||||||||||||||||||||||||||||||||||||||||||||||||||||||||||||||||||||||||||||||||||||||||||||||||||||||||||||||||||||||||||||||||||||||||||||||||||||||||||||||||||||||||||||||||||||||||||||||||||||||||||||||||||||||||||||||||||||||||||||||||||||||||||||||||||||||||||||||||||||||||||||||||||||||||||||||||||
|
©2025 Lester Gilbert |