.htm_cmp_lghome010_bnr.gif)
![]()
![]()
![]()
![]()
![]()
![]()
|
|
|
Sheeting for Drive or Efficiency?
by Lester Gilbert
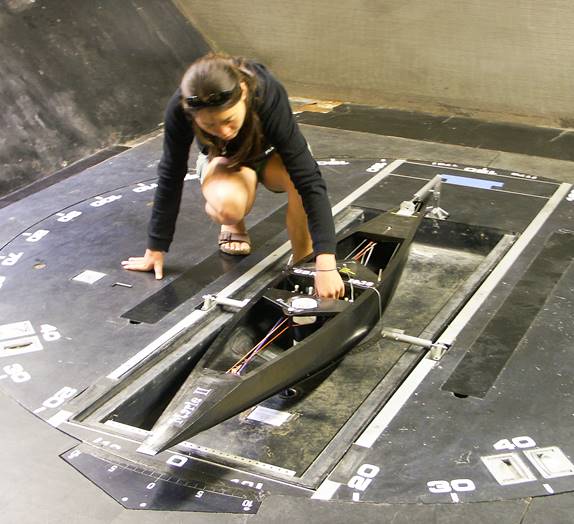
Wind tunnel
The “7 x 5” closed-circuit wind tunnel has a low-speed 3.7 m
by 4.75 m octagonal section with an operational velocity range between 1.5 m/s
and 15 m/s. The dynamometer mounted underneath the low-speed section floor
provides data for six components: drive, heel, and vertical forces, and pitch,
heel, and yaw moments. It is mounted onto a turntable that can be rotated,
allowing any wind angle. The turntable has a water bath to simulate the floating
condition of a hull, sealing the hull to the tunnel floor.
Figure 1. Attaching the A
Class Sword hull to the wind tunnel dynamometer.
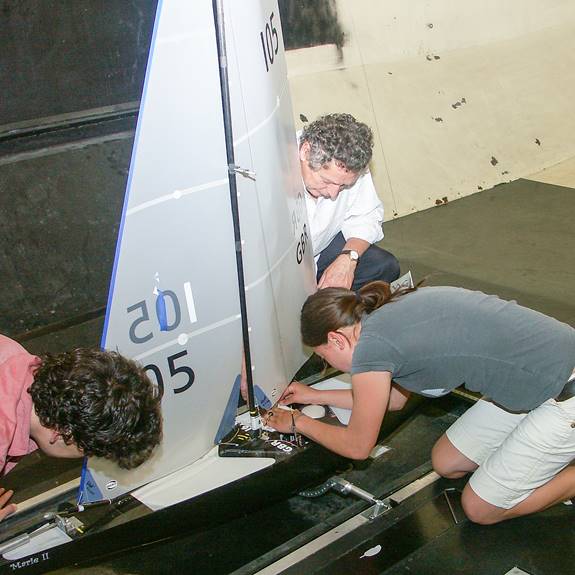
Figure 2. Setting up the
rig. Experiment
The wind tunnel was set to a wind speed of 3 m/s, the hull
heeled to 30 degrees, and the boat trimmed to close-hauled at apparent wind
angles of 27, 30, 33, 36, 39, and 42 degrees, in turn. For each wind angle, trim
was adjusted until maximum drive was shown on the computer data acquisition
display in the control room, and force readings taken. Then, the sails were
sheeted in by one “click” on the transmitter, and force readings taken a second
time. Finally, the sails were sheeted out by two “clicks,” and a third set of
force readings taken. A “click” on the transmitter had the effect of changing
the sheeting angle of the jib and of the main by approximately 2 degrees.
Results
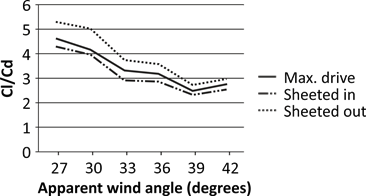
The force readings were analyzed, and for each test run, the
ratio of the coefficient of lift, Cl, to the coefficient of drag, Cd, was
calculated. The lift-to-drag ratio varied from around 5 when pinching at an
apparent wind angle of 27 degrees, to around 3 when footing or close reaching at
an apparent wind angle of 42 degrees. Figure 3 plots the lift-to-drag ratio for
the three sheeting conditions at each of the six apparent wind angles.
Figure 3. Lift to drag
ratio when sheeted for maximum drive, eased, or tightened. Discussion
The graph shows that easing the sheets a fraction from a
position of maximum drive sees efficiency—lift-to-drag ratio—increase even as
drive is no longer maximized. And as might be expected, tightening the sheets a
fraction from a position of maximum drive means that efficiency drops, as well
as maximum drive. So what should I be trying to do—maximize drive, or maximize
efficiency?Acknowledgements
The project was undertaken by Jessica Ma under the
supervision of Prof. Philip Wilson of the University of Southampton’s Department
of Ship Science. |
|
©2025 Lester Gilbert |