|
Wetted Surface Area
by Lester Gilbert
One of the perennial issues in designing and building hulls
is to minimize wetted surface area, because we know that a significant component
of hull drag is due to wetted area. Should we make our fin or rudder narrow and
short rather than wide and deep? Should we lean towards a deep V rather than a
skimming dish? Should we find some depleted Uranium for our ballast? (Just
kidding, folks, just kidding…!) What we don’t usually know is how much extra
drag a little extra area gives us. Graham and I ran some tests in the towing
tank, and one of the outcomes was some insight into the relationship between
extra wetted surface area and resulting hull velocity.
Towing tank testing
A couple of issues ago (#174 to be exact), I described how we
ran some experiments in the Lamont towing tank of the University of Southampton.
We continued to use a refined version of Graham’s falling weight device (FWD),
comprising an axle and a drum, to tow our hulls. A line is wrapped around the
axle several times and attached to a weight. A second, towing, line is attached
to the drum at one end, and to the hull at the far end of the towing tank at the
other. Release the weight, and the drum rotates, reeling in the line and towing
the hull.
For our latest series of tests, we have developed improved
timing accuracy and repeatability. Previously, I timed the models by filming
them with a video camera. The video frame, which showed the model bows just
crossing a sight line, gave me a time which was accurate to within 1/30th of a
second, because the camera video operated at 30 frames-per-second. But as might
be imagined, I had problems with camera shake, focus, sight alignment with
high-speed runs, and general nervousness running alongside the tank with several
thousand pounds of camera equipment in my hands.
This time I used remote triggering of timers when laser beams
were interrupted. The general arrangement is illustrated in Figure 1. We had
three laser beams and associated triggers. The first trigger started a pair of
simple laboratory timers, accurate to 1/100th of a second. The second trigger
stopped the “A” timer to record the acceleration period of the model run,
between 4 and 14 seconds over around 5 metres, and the third trigger stopped the
“T” timer to record the full-speed period of the run, between 6 and 20 seconds
over around 7 metres, depending upon the towing force generated by the FWD.
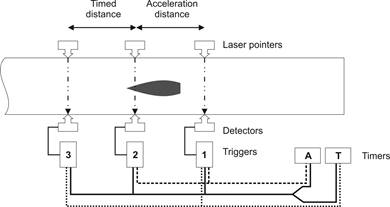
Figure 1. Towing tank
set-up.
Each laser beam comprised a laser pointer and a remote light
sensor, shown in Figure 2. The sensor was wired to the trigger, which detected
when the beam was interrupted by the passage of the hull’s towing post. The
laser pointer was accurately aimed using thumbscrews in a carriage clamped to
the side of the tank. The red dot seen in Figure 2 on the other side of the tank
is the reflection of the beam from the lens of the light detector, itself
clamped to the tank exactly perpendicular.
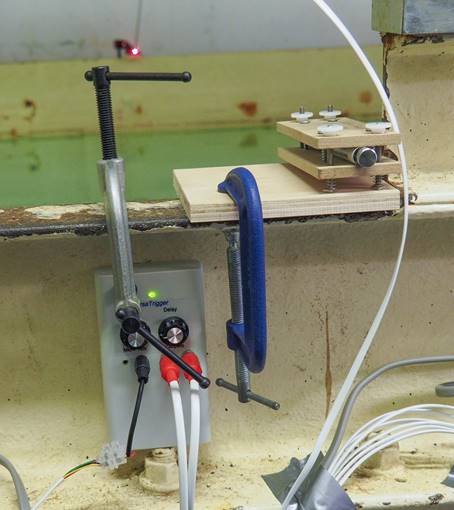
Figure 2. Laser beam and
trigger set-up.
The trigger, shown lightly clamped to the tank side, has a
green LED that tells us that the laser beam is correctly set. The exceptionally
helpful folks at “VersaTrigger” (http://versatrigger.co.uk/) made a small change
to the detector circuitry so we could set a larger than usual time-out. Usually,
the trigger resets almost immediately and anything that then interrupts the beam
will send another trigger signal. We didn’t want another trigger signal until
the run had ended, the timings had been recorded, and the model had been
returned to its starting position ready for another run, so we were given an
extended time-out of around 40 seconds. Perfect.
We found that timing accuracy was indeed within 1/100 s, and
was repeatable to within 1/100 s, both quite exceptional outcomes given the
relative unsophistication of our equipment and set-up.
RG65 fins
To look at wetted surface area effects, we towed an RG65 hull
with two different fins at three different speeds. The
long fin had a surface area
approximately 270 sq. cm, and the short
fin area was around 245 sq. cm. The RG65 hull, rudder, and bulb together
comprised a wetted surface of around 950 sq. cm, so the difference in wetted
surface area between the two fins was around 2.3% of the total.
We used three FWD weights resulting in three towing speeds,
low, medium, and
high, such that the hull reached
velocities of approximately 0.45 m/s, 0.65 m/s, and 1.2 m/s respectively.
Now, just before you see the results, you should have a guess
about your expectations. Do you think that an extra 2.3% wetted surface area
would slow the boat down by a similar amount, around 2 or 3%? Do you think the
boat would be slowed down equally across the different towing speeds? Or do you
think the extra area would slow the boat down more at low towing speed than at
high speed? Or the other way around? And if you don’t have a thought right now,
heck, don’t peek, give it a go. OK? Here are the somewhat surprising results…
Effect of extra wetted surface area
The timed run took somewhere between 6 and 20 seconds,
depending on the FWD towing force. Three runs were made for each towing speed
for each fin, giving a total of 18 runs. The time for the three runs was
averaged, converted to an average velocity, and the percentage change in
velocity for that towing force was calculated—a “delta %” from the lowest
velocity. The measurement error for each delta was estimated as a standard
error, and it is worth noting that the standard error of the delta (velocity
change) was of the order of 0.2%. That is, using classical statistics, we can be
95% confident that a delta of, say, 2.5% in average velocity is indeed somewhere
between 2.1% and 2.9% (plus and minus two standard errors). The resulting graph
is shown in Figure 3.
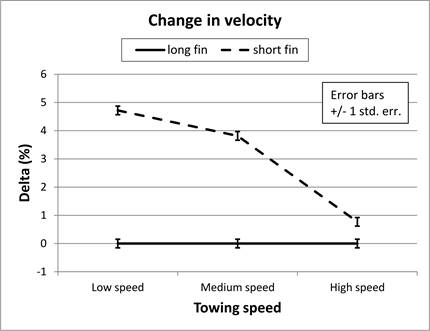
Figure 3. Change in hull
velocity at three towing speeds with long and short fins.
We can see from Figure 3
that, at medium towing speed, for example, the additional wetted surface area of
the long fin slowed the hull by 3.8% relative to the short fin. This difference
is highly statistically significant, as may be seen by the fact that the error
bars are much shorter than the differences they calibrate. At low towing speed,
the difference in hull velocity is around 4.7%, while at high speed it is much
less, around 0.7%, but still significant. Did you guess that?
Discussion and conclusions
We see that a modest
additional wetted surface area, 2.3%, has disproportionately slowed the hull by
4.7% at low speed, and equally disproportionately had a much smaller effect at
high speed, slowing the hull by only
0.7%.
Why is that? The simple
answer is that at high towing speed a large proportion of the hull’s drag is
wave drag, and the frictional drag component of the additional fin area is
masked. At the lower towing speed the wave drag is not dominant, the drag due to
wetted surface area is proportionately higher, and so the short fin hull with
lower wetted area shows as having significantly lower drag and hence higher
velocity.
If you think your day’s
sailing will be in light or very light airs, well, a smaller rudder or a smaller
fin will help you. On an RG65, a 20% smaller rudder will give around 2%
reduction in wetted area. Other things being exactly equal, hull velocity
upright in a straight line (no waves!) might be expected to increase by around
4% respectively.
If you think your day’s
sailing will be in heavier airs, well, you can increase your fin length (if your
class rules permit) and not suffer excessively. The hit on hull speed when
stability is of little value, as when sailing downwind, is proportionately much
lower, and performance would probably be easily recouped by improved stability,
that is, increased righting moment, when sailing to windward.
Acknowledgements
These experiments would
not have been possible without Graham Bantock’s enthusiasm and knowledge, or
without the support of the University of Southampton.
|
.htm_cmp_lghome010_bnr.gif)