|
Lift-to-Drag Ratio
by Lester Gilbert
While looking at the question of sheeting when close-hauled,
and deciding whether I was maximizing drive or maximizing efficiency, I became
interested in the difference between velocity made good (VMG) and pointing. In
order to get to some sort of answer, it turns out we are going to have to travel
quite a journey. We’ll start with the lift-to-drag ratio, a measure of the
efficiency of rigs and foils. Next, we’ll review the course theorem, also known
as the beta theorem, which explains how our ability to point depends on our
boat’s efficiency. Then, we’ll consider VMG, which is the theory behind finding
the pointing angle or heading that maximizes our progress towards the windward
mark. It isn’t the angle at which our boat sails the fastest, and it may not be
the highest angle at which we can point if we want to. Finally, we’ll pull it
all together to find out the optimum heading for maximum VMG.
Lift
We know that sails operate like airplane wings, producing
lift when the wind blows over them. In order to compare different sails under
different conditions, engineers often use coefficients that remove the
particulars and leave the essence of
the effect they are considering. For us, we’ll talk about the lift coefficient,
a standardized measure of how much a sail or fin develops lift. To get the
actual lift generated by a sail, we need to know the wind speed, the air
density, and the area of the sail. It is important to remember that the
coefficient just tells us about lift per unit area, unit speed, and unit
density.
Figure 1 shows typical lift coefficients for an IOM rig. This
figure is a little different from other graphs you might see, because it shows
the lift coefficient for different heading angles rather than different angles
of attack, and it shows these coefficients for the rig as a whole, that is, with
the foresail and mainsail operating together, rather than for just one sail. At
each heading angle, the coefficient shown is what is calculated to be the best
lift that the rig can produce at that particular heading. So we can see that the
lift coefficient is rather low when the boat is heading at an angle of 10
degrees to the true wind, becomes a maximum when beating at a heading of around
40 degrees, and then slowly reduces as the boat bears off to a reach.
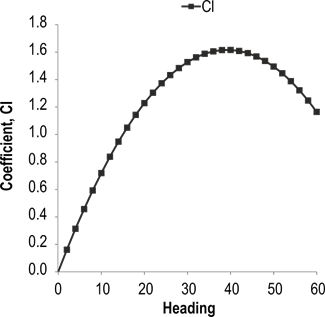
Figure 1. Lift coefficients
for an IOM rig at various headings.
Drag
Even when a rig is not developing lift, it causes drag.
Figure 2 shows typical rig drag coefficients for an IOM rig at different heading
angles. Again, this is a little different from other drag graphs you might see,
as explained for the lift coefficient graph, but in general it shows drag
increasing, slowly at first, as the boat turns towards a reach. You can imagine
the rest of this graph, showing increasing drag to a maximum at 180, as the boat
heads to a run.
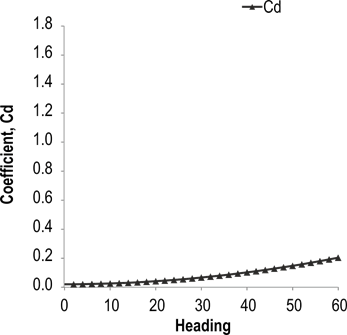
Figure 2. Drag coefficients
for an IOM rig at various headings.
Lift to Drag
Ratio
Aerodynamicists figured out a while ago that the lift and
drag characteristics of a given airfoil needed to be combined in some way to
give an overall picture of performance. They were mainly interested in
efficiency, and this is given by the lift-to-drag ratio. The lift-to-drag ratio
tells us how much useful performance we are getting, lift, in relation to the
stuff we don’t want, drag. A number of airfoils, particularly glider wings, seek
extreme efficiency and can post lift-to-drag ratios of around 70 or 80. Figure 3
shows the lift-to-drag graph for our lift and drag coefficients.
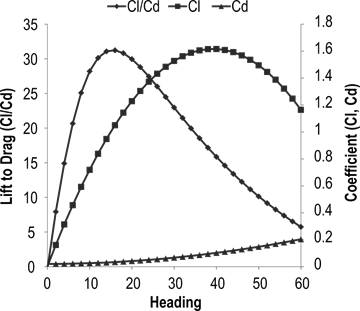
Figure 3. Lift-to-drag
ratios for an IOM rig at various headings, alongside Cl and Cd.
We can see that at maximum lift, at around a heading of
40 degrees, the rig efficiency is rather low, with Cl/Cd = 16, half of what it
is at maximum. We can see efficiency sinking even lower as the boat bears off to
a reach. On the other hand, we know that our boats spend most of their time
beating to windward at a heading of around 30 or 35 degrees and are fastest on a
reach when heading around 90 degrees. So, this explains why we don’t talk much
about lift-to-drag ratios; the concept has limited application to our sailing.
We can see that maximum rig efficiency occurs at a heading of
around 15 degrees or so, with Cl/Cd = 31, corresponding to the peak of the Cl/Cd
curve. We know that no sailing boat currently will get anywhere useful trying to
sail at 15 degrees to the wind, even though it might be creeping along very
efficiently. So again this explains why we don’t talk about rig lift or drag
ratios, or efficiency, very much. We do talk about it a little, though, as we
will explain when we get to the course theorem and discuss how well a boat can
point. It turns out that it is rig (and hull) efficiency that determines how
close we can get to the wind.
Acknowledgements
Graham Bantock made some helpful comments on an earlier draft
of the article.
|
.htm_cmp_lghome010_bnr.gif)