|
Tripping the Boundary Layer
by Lester Gilbert
Toward the end of our experiments in the towing tank we
wondered if we could measure differences in hull drag due to small
irregularities on the hull. One case concerned the application of a thin tape to
mark the waterline, and we used a 10-Rater (10R) hull for this experiment,
illustrated in Figure 1. Another case involved taking a well-used fin and
fairing its leading edge. For this we towed a Marblehead.
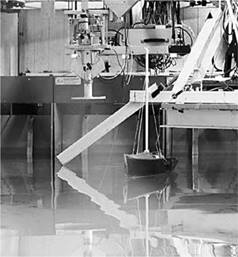
Figure 1. Ten-Rater hull in
the towing tank.
At low speeds the viscosity of the fluid is a dominant
factor, which tends to damp out any irregularities that occur in the flow along
a surface or past an obstruction. This is why laminar flow occurs at low
speeds—imagine molasses flowing out of a can onto a spoon. Even sharp corners do
not cause lasting turbulence in the flow, which recovers from the local
disturbance and remains very stable downstream. At higher speeds fluids become
relatively less viscous and when disturbed from their laminar flow state, will
remain turbulent—imagine the upward flow of smoke from a cigarette in a room
with no drafts. The flow is smooth and streamlined for some distance, and then
it becomes turbulent, never to recover the streamlined flow again. At still
higher speeds the flow will be turbulent virtually from the outset.
So the question is, will any irregularity in the forward
surface of the hull or fin cause the expected laminar flow to be tripped to
turbulent flow and cause a jump in frictional drag? Or will the flow recover its
laminar nature and show negligible drag increase?
10R waterline marks
One kind of boundary layer trip is the thin tape used to mark
waterline endings in classes such as the 10R, A, and M. We towed a 10R hull with
two normal waterline marks and then with no waterline marks. We used two FWD
weights to give two towing speeds, low
and high, such that the hull reached
velocities of approximately 0.4 m/s and 0.9 m/s respectively.
As is traditional with these experimental reports, just
before you see the results, what are your expectations? Do you think that a thin
waterline tape on the hull at the bow, about 6 mm wide, 50 mm long, and 0.15 mm
thick, and another longer one at the stern would measurably slow the boat? Do
you think the boat would be slowed down equally across the different towing
speeds? Or do you think the boundary layer trip would slow the boat down more at
low towing speed than at high speed? And if you don’t have a thought right now,
heck, don’t peek; give it a go. OK? Here are the interesting results… I say
interesting, because we took the same test ourselves before the experiment and
agreed that any difference in drag would not be measurable. We were wrong!
Effect of waterline marks
The timed run took somewhere around 8 seconds and 19 seconds
for the high and
low FWD towing forces. Three runs
were made for each towing speed, for each configuration of the marks, giving a
total of 12 runs. The time for the three runs was averaged, converted to an
average velocity, and the percentage change in velocity for that towing force
was calculated—a “delta %” relative to the lowest velocity recorded. The
measurement error for each delta was estimated as a standard error, and it is
worth noting that the standard error of the delta (velocity change) was of the
order of 0.2%. That is, using classical statistics, we can be 95% confident that
a delta of, say, 1% in average velocity is indeed somewhere between 1.4% and
0.6% (plus and minus two standard errors). The resulting graph is shown in
Figure 2.
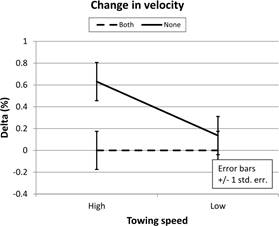
Figure 2. Change in hull
velocity at two towing speeds with different waterline ending
marks.
We can see from Figure 2 that, at the high towing speed,
having no waterline marks allowed the hull to run faster by around 0.62%. This
difference is statistically significant, as may be seen by the fact that the
error bars are reasonably shorter than the differences they calibrate. On the
other hand, at low towing speed, the difference in hull velocity is not
significant, and having waterline marks did not seem to affect hull speed. Did
you expect any of that?
What is happening here? Probably at the lower speed the limit
mark is tripping the flow at the bow into turbulent flow, but the flow is
sufficiently robust for it to recover its laminar state very quickly. So there
is little or no measureable increase in drag. At the stern the flow will
probably be turbulent anyway and the aft limit mark will not have much
disturbing effect on the flow. At the higher speed the flow is less robust (the
water is less relatively viscous), and trip of the flow into turbulence is
somewhat longer lasting. The increase in drag, however, is much less than would
be expected if the flow were to be changed fully from laminar to turbulent.
Marblehead fin leading edge
To look at another kind of hull irregularity, we towed a
Marblehead hull with a fin in its original condition, and then with its leading
edge faired nicely with some wet-and-dry, 800 grit sandpaper. We used two FWD
weights resulting in two towing speeds,
low and high, such that the hull
reached velocities of approximately 0.4 and 1.0 m/s respectively.
Again, just before you see the results, what are your
expectations? Do you think that a somewhat rough leading edge on the fin would
measurably slow the boat? Do you think the boat would be slowed down equally
across the different towing speeds? Or do you think the leading edge (LE)
roughness would slow the boat down more at low towing speed than at high speed?
And if you don’t have a thought right now, c’mon, we’ve given some strong hints.
OK? Here are the interesting results… I say interesting, because I took the same
test myself before the experiment, and thought that it was a no brainer, a
faired LE would make a measurable change to the drag. Was I wrong?
Effect of faired fin leading edge
The timed run took somewhere around 7 and 17 seconds
depending on the FWD towing force. Three runs were made for each towing speed,
for each fin condition, giving a total of 12 runs. The time for the three runs
was averaged, converted to an average velocity, and the percentage change in
velocity for that towing force was calculated—a “delta %.” The measurement error
for each delta was estimated as a standard error, and it is worth noting that
the standard error of the delta (velocity change) was of the order of 0.2%. That
is, using classical statistics, we can be 95% confident that a delta of, say,
0.4% in average velocity is indeed somewhere between 0% and 0.8% (plus and minus
two standard errors). The resulting graph is shown in Figure 3.
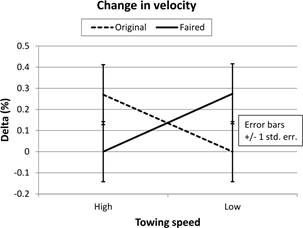
Figure 3. Change in hull
velocity at two towing speeds with original and faired fin.
We can see from Figure 3
that the differences in hull velocity, around 0.27%, were within measurement
error (the error bars overlap), and could not be called significant. Did you
guess that?
Discussion and conclusions
We see that waterline
measurement marks have slowed the 10R hull by around 0.6% at high speed, while
there is no significant effect at low speed. We see that fairing a rough leading
edge of a Marblehead fin did not show a measurable effect at either speed.
It seems that it would be
worth painting your waterline marks onto your hull rather than using a tape,
even a thin tape. That surprised us. The size of the effect is, of course, small
and can only show up in the highly controlled conditions of a towing tank—flat
water, upright towing, no other forces, measuring to 1/100 s. It would be the
equivalent of 60 cm over a run of 100 m—less than half a boat length for a 10R,
but worth having.
On the other hand, don’t
let the lack of a significant difference due to a fin’s rough or smooth leading
edge fool you. Although the fin was well used, only Graham noticed that its edge
was a little rough and needed cleaning up. Me, I didn’t notice. The results are
suggestive, if not conclusive—fairing the LE made a fractional difference of
0.27% at high speed. The tests were all made with no side force, equivalent to
sailing downwind, and it may be that the difference would be larger where the
fin operates at an angle of attack (leeway) in order to develop lift.
Those of you with a
statistical background might like to know that the p value of the difference was
0.09. Not quite the conventional 0.05, but, ah, suggestive. And we know that the
little things add up.
Acknowledgements
These experiments would
not have been possible without Graham Bantock’s enthusiasm and knowledge, or
without the support of the University of Southampton.
|
.htm_cmp_lghome010_bnr.gif)