![]()
![]()
![]()
![]()
![]()
![]()
|
|
|
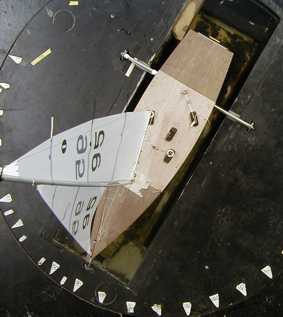
The sails were run at a tunnel wind speed of about 4.3 m/sec, pretty much towards the top of the "A" rig wind speed range. The photo gives an idea of the wind tunnel arrangement, taken from the roof of the tunnel. The sails, on loan from Graham Bantock, were mounted on an existing test hull. For this particular run, the wind is coming from the bottom of the picture at an angle of 30 degrees. The shape of the jib looks good, but the mainsail shape isn't wonderful. It is quite flat due to a fair amount of mast bend, and has been sheeted out a little more than "usual" to limit its drag. The hull is mounted an a "T" bar which is then fixed to the dynamometer points on the turntable. The white triangles on the turntable indicate various headings.
For a given heading, the sails were trimmed to optimise lift-to-drag, and then a variety of readings taken for somewhat different sheeting angles. The results show a spread of drive and heeling forces. Note that the jib was trimmed independently of the main, so the results show "optimum" configurations which might not be able to be achieved in practice with a racing IOM. Note also that the wind speed and direction is the APPARENT wind for the sails, that is, the wind that the sails "see" when operating. Because the hull in fact isn't moving at all, the TRUE wind is somewhat different, that is, the wind you would feel while standing on the bank sailing your boat. The first graph shows how the drive force starts fairly modestly when the apparent wind is at a heading of 30 degrees to the hull, about 2.5 to 3.5 Newtons, and then builds steadily as the wind shifts to the beam, when it reaches about 10 Newtons (just over 1 kg force). Heeling force is initially high for the close-hauled angles, up to 10 N, and then drops off for the reach to about 3 N. Because the apparent wind is constant at 4.3 m/sec, the true wind is different for each wind angle. At 30 degrees apparent, the true wind would be about 3.2 m/sec, at a true angle of 41 degrees, if we assume the boat is zipping along at "hull speed", about 1.25 m/sec. When the apparent wind is directly on the beam at 90 degrees, the true wind is in fact somewhat aft at about 106 degrees and blowing at about 4.4 m/sec.
On the run, for the higher true wind angles, the sails were set either goose-winged, or not goose-winged. The following graph shows the resulting drive versus heeling forces. NOTE that the drive force axis starts at 8 N in order to show the data points more clearly. It is also clear that a couple of the data points are anomalous, for example, there is a blue data point of the "120 no g/w" series to be found below the green "145 no g/w" series. It is interesting to see how the drive force drops off when the sails are set for a dead run, a course of 180 degrees, by comparison with the drive available at somewhat higher courses of 165 or 145 degrees. I really would like to do some two-boat testing on a steady breeze to see if downwind "tacking" pays off. An IOM is undoubtedly faster on a quartering run than on the dead run, but doesn't the extra distance covered always negate the advantage? It is also interesting to see that drive force is considerably higher with sails that are goose-winged than otherwise. Again, because the apparent wind is fixed at 4.3 m/sec, the true wind is different, and somewhat higher in speed. Again, if we assume the hull hasn't nose-dived and is driving along at 1.25 m/sec, at 180 degrees the true wind is around 5.55 m/sec, which would in reality be somewhat outside of the "A" rig wind range.
Again, because the apparent wind is fixed at 4.3 m/sec, the true wind is different, and somewhat higher in speed. Again, if we assume the hull hasn't nose-dived and is driving along at 1.25 m/sec, at 180 degrees the true wind is around 5.55 m/sec, which would in reality be somewhat outside of the "A" rig wind range. Calculation of coefficientsGiven the actual heeling and drive forces, the next step was to calculate the lift and drag coefficients for the rig. Windage effects were estimated and removed (rigging, mast, etc), the forces were resolved into the sail co-ordinate system from the boat system, and the coefficients calculated. The results are shown below for "on the wind".
First thing to notice is the wide variation in lift coefficient for a given heading. For example, with the apparent wind at 40 degrees, Cl varied from a low of about 0.66 to a high of about 1.34. This variation, which matches the variation in raw drive force, arises because the sail sheeting was adjusted for each run in the wind tunnel at a given heading, from over-sheeted to under-sheeted, such that the lift-to-drag ratio remained maximised. Second thing to notice is that there is therefore a reasonably nice linear relationship between lift and drag (except for 90 degrees). The linear trend lines were calculated on the assumption that drag would be zero at zero lift (remember, in theory all the windage effects had been removed), and so it is the slope of the line which shows how induced drag builds up with increased lift. For the 40 degree trend line, for example, Cd increases 0.22 per unit Cl. The most interesting this to note about the graph, however, is how the trend lines are stacked, one above the other, in relation to the wind angle. When talking about lift and drag, the difference between the trend line at, say, 30 degrees by comparison with those at 70 degrees, is due to the fact that at 30 degrees the slot between jib and main is minimised, and at 70 degrees the slot between jib and main is close to maximum. Specifically, at 30 degrees, the best Cl was about 1.3, and associated with this was a Cd of about 0.25. At 70 degrees, a similar best Cl was about 1.34, but the corresponding Cd was around 0.48 -- twice as much drag. This provides evidence for the idea that, when close-hauled, a well-set slot enables jib and main to work together to produce lift more efficiently. Conversely, when reaching, there is no slot as such, the jib and main act much more as two independent sails, and thus the rig as a whole shows a higher drag coefficient. Heck, this is why biplanes and triplanes were abandoned soon after WW1 and the world went with monoplanes... 2005-12-18 |
|
©2025 Lester Gilbert |